![]() Social
Interaction. Video-Based Studies of Human Sociality.
Social
Interaction. Video-Based Studies of Human Sociality.
2019 VOL. 2, Issue 1
ISBN: 2446-3620
DOI: 10.7146/si.v2i1.113145
Social Interaction
Video-Based Studies of Human Sociality
Drawing as transcription: how do graphical techniques inform interaction analysis?
Saul Albert1,4, Claude Heath2, Sophie Skach3, Matthew Tobias Harris3, Madeline Miller4, Patrick G. T. Healey3
1School of Social Sciences, Loughborough University, Loughborough UK
2Department of Information Security, Royal Holloway University of London, London, UK
3Department of Computer Science and Electronic Engineering, Queen Mary University of London, London, UK
4Berklee College of Music, Boston, USA
Drawing as a form of analytical inscription can provide researchers with highly flexible methods for exploring embodied interaction. Graphical techniques can combine spatial layouts, trajectories of action and anatomical detail, as well as rich descriptions of movement and temporal effects. This paper introduces some of the possibilities and challenges of adapting graphical techniques from life drawing and still life for interaction research. We demonstrate how many of these techniques are used in interaction research by illustrating the postural configurations and movements of participants in a ballet class. We then discuss a prototype software tool that is being developed to support interaction analysis specifically in the context of a collaborative data analysis session.
Keywords: Drawing, Transcription, Data sessions, Multimodality, Software
1. Graphical approaches to transcription
Graphical techniques have informed conversation analytic transcription from the very beginning but are relatively underspecified in methodological terms (Ayaß 2015). Cekaite & Goodwin (2018 pp. 23-26) describe how, in the summer of 1973, Gail Jefferson began working with video by laying transparencies on top of a television screen and tracing the relevant features of embodiment from a video of family mealtimes. However, while Jeffersonian conventions for transcribing talk as text have now become a widespread method, and are well discussed within the social sciences (Hepburn & Bolden 2016), Jefferson’s graphical techniques were never incorporated into her foundational program of work. More generally, despite the turn to embodiment in interaction research (Nevile 2015), few discussions of transcription systems explore graphical approaches to the challenges of studying talk and multimodal interaction (Ayaß 2015: 517). Similarly, few studies have focused, reflexively, on how the transcript is actually used by analysts in the course of their work (although see Tutt & Hindmarsh 2011; Laurier 2013), or on how the software systems that have been developed for interaction analysis such as ELAN (Wittenburg, Brugman, Russel, Klassmann, & Sloetjes 2006) or CLAN (MacWhinney 2000) function, as Alac (2008) describes software used for brain imaging, as highly constrained analytic “techniques for seeing”. While Jeffersonian transcription has become a procedure for discovery in conversation analysis (CA), through which researchers develop their analytic sensitivities (Bolden 2015; Sidnell 2010 p. 23), the profusion of still images, box and arrow diagrams and overhead elevations that Laurier (2014) calls ‘graphic transcripts’ are usually used illustratively to present finished results, rather than – as with Jeffersonian transcription – as an integral part of the analytic process.[1] Here, however, we ask how drawing may also be used as an exploratory method for interaction research. Inspired by Gail Jefferson’s focus on the practical uses of transcripts, we start by asking how professional analysts use transcripts during the course of analysis in data sessions. We then explore two graphical techniques that are widely used in interaction research. We explain their limitations and potentials by applying them to the analysis of interactions in a ballet class. Finally, we describe a prototype software tool designed to support analytic drawing and discuss the prospects for drawing alongside transcription in interaction research.
1.1 Multimodal transcription in interaction research
Canonical conversation analytic transcription methods and symbols[2] are used to analyze talk, laughter and other vocal phenomena that were central to early studies of telephone-mediated interaction (Laurier 2014). Jefferson’s conventions for transcribing talk as text have been consistently updated and extended to also describe text-based interactional resources and situations. For example, Meredith’s (2017) system for transcribing real-time Facebook chat extends Jefferson’s system by using icons to represent ‘writing’ status notifications. Similarly, the challenges of studying embodiment and mobility in interaction (Mondada 2016) have inspired enhancements to Jefferson’s system, which have developed incrementally over the last 40 years (e.g. M. H. Goodwin 1980; Goodwin 1981; Heath 1984). More recently, Mondada’s (2018) multimodal transcription conventions represent the state-of-the-art in this ongoing development process and are becoming a de-facto standard for transcribing embodiment in interaction. This system maintains Jefferson’s semi-diagrammatic spatial placement of concurrent or overlapping lines of talk and combines them with video stills keyed to specific positions on the page. The onset, sustain and retraction phases of gestures are also shown on their own line using (respectively) periods, commas and dashes, together with descriptions delimited by symbols to show how multiple bodies and trajectories of action unfold over time.
While Jefferson’s colleagues and mentees were extending her transcription system, it also seems that Jefferson herself was trying out different approaches to analyzing video footage of bodily actions. In a recorded lecture on the Learning How to Look and Listen website[3], the late Charles Goodwin describes learning to analyze embodied interaction with Gail Jefferson in 1971 without using, or focusing on transcripts at all. Instead, as he puts it, their analysis sessions involved “just looking at tape and saying, ‘Ooh! Ooh! look at that’, so my focus is on people [i.e. analysts] looking at tape together rather than on presentations or starting with a written transcript”. By this account, the primary process of analysis is to harnesses interaction between the researchers in front of the materials as an inductive tool for pointing things out in the recordings, with transcription being just one means to this end. Jefferson may also have been developing new approaches to transcribing embodiment in interaction that were never clearly codified. For example, Cekaite and M. H. Goodwin’s (2018) description of Jefferson tracing over a television screen suggests that she was developing new graphical methods for preparing materials for analysis, and Drew (2016 pp. 16-17) describes Jefferson’s early attempts to adapt Labanotation—a graphical format for choreographic notation (see Guest 2013)—for interaction research. Furthermore, her conversations with Harold Garfinkel and Howard Schwartz (Garfinkel 1966), also reveal how Jefferson’s dance expertise informed their thinking about the activity of schematizing bodily action via transcription. They discuss the practical uses and functions of Labanotation and its inadequacy for the practical activity of inscribing, instructing and reproducing choreographed movement. Jefferson compares her early attempts to transcribe talk with the challenges of using and making Labanotation, and they discuss whether the transcript constitutes instructions to be followed (by dancers), descriptions made (by transcribers), or an entirely new and different contrivance. Jefferson emphasizes the dimensions of practical experience involved in creating and using Labanotation rather than focusing on the epistemological status or adequacy of the transcript as an ostensible representation of the dancers’ actions. In use, the score’s instructions become, as Garfinkel and Jefferson (Ibid: 16) put it, “infinitely penetrable”, where the choreographer and the dancers must “work it out under each other’s gaze”, by approaching it “as if what’s there is sufficient information to reproduce the dance; so that… each time it comes up you have to deal with it”. Although Jeffersonian transcription has been described both as a form of analysis (Bolden 2015) and theory (Ochs 1979), Jefferson herself (2004: 13) describes it as “just something one does to prepare materials for analysis, theorizing, etc.” She saw transcripts as tools for the ‘real work’ of data analysis.
1.2 The praxeology of CA transcripts
In order to explore the practical uses of transcripts we studied video recordings of experienced human interaction analysts at work. In particular, we looked at a video analysis data session involving Charles Goodwin and John Haviland.[4] In a typical data session, groups of analysts use the transcript as an anchor for inductive observations (Sacks 1984, p. 26; ten Have 2007, pp. 140-142), refining the transcripts through repeated playback of recordings (Hindmarsh 2012) while making descriptive observations of the visible actions of the participants.
Extract 1: Charles Goodwin and John Haviland working on video data
In this short video clip, we see five related moments in the data session that show how analysts use gesture to consolidate their spoken observations. For example, in lines 1-2 of Extract 1, JH raises one hand over the other as he describes a similar movement by a participant in the video data that they are studying. As JH’s arm extends upwards, CG’s head lifts, tracking JH’s hand, then comes down as he says “Right” in line 2, in overlap with JH’s reference to “this thing”. These closely interwoven ‘gestural reenactments’ (Tutt & Hindmarsh, 2011) and verbal descriptions show how participants’ actions in the video are constructed as identifiable analytic phenomena in and through interaction. The analysts hardly use the printed transcript in this session. Instead, they use these situated interactional methods in order to identify and return to particular moments in the video. Notably, in lines 6-8, JH, who often uses drawing in his analytic work (e.g. Haviland 2000), waves towards the transcript and says they cannot transcribe the gesture they have just identified because they do not have the tools for transcribing it. In this session at least, then, the transcripts of talk do not necessarily support the practical analytic activity since they would split each analyst’s focus between the transcript, each other’s gestural re-enactments, and the courses of action unfolding on the screen (Tutt & Hindmarsh 2011). Reflecting on this single case raises some intriguing questions about transcription, tools for inscribing these kinds of gestures, and their practical and methodological uses. What tools would be required for transcribing this kind of gestural action? Should drawing form part of the work of researchers interacting during data analysis, or is it, as Jefferson (2004) puts it, ‘just’ preparatory work? Before addressing these issues in practice, we should also ask some basic questions about the role and rationale of graphical representations in interaction research.
1.3 Graphical and spatial conventions in interaction research
Graphical representations in scientific research more generally constitute ‘renderings’ of the research processes and theories that produce them (Lynch 2005). In still-dominant Cartesian models of bodies, minds and codes for communication (Coulter 2005), these representations are therefore usually constructed around a body-centric spatial schema (C. P. Heath 2014). For example, a typical depiction of a bodily action might focus on a single figure gesturing to off-camera investigators in a laboratory within a distinct ‘gesture space’ (McNeill 2003), which spatially separates the body from an accompanying transcript of speech. Since the earliest comparative studies of gesture (e.g. Efron 1941), graphical representations of bodies and space in communication reseach adobt this analytic separation of talk from the body, and between the speaker and the recipient. For example, McNeill (1992, p.86) uses the term ‘gesture space’ to describe a limited area that “can be visualized as a shallow disk in front of the speaker”, the lower half of which is truncated when the speaker is seated. This ‘space manikin’ schema is often used for analyzing video footage of experimental participants. Kendon (1990: 209-238) uses an alternative schema in which overlaps between the forward-facing and body-centered ‘transactional segments’ of individuals produce ‘joint transactional space’, resulting in a jointly maintained ‘o-space’ that is usually depicted centrally between the bodies of participants in interaction. By contrast, ethnomethodological video-based studies of social interaction (Heath, Hindmarsh & Luff 2010) tend to focus on two or more people interacting in naturalistic settings. The focal phenomena in these studies include turn-taking, joint attention, and coordinated uses of institutional and socio-technical spatial configurations such as control rooms or auction houses (Heath & Luff 2011). In interaction, participants gesture together and collaboratively construct spatialized interactional resources for sense-making (Healey and Peters 2007). This type of interactional ‘gesture space’ differentiates spaces in relation to, for example, abstract ‘topic spaces’ (C. P. Heath 2014, pp. 315-319), which participants can use to connect and manipulate the topical and referential structure of their conversation as it unfolds. These spaces arise from – and can be best understood in relation to – interaction (Battersby et al. 2008; Healey and Battersby 2009), and how they are structured and upheld through participation in situated activities (Goodwin & Goodwin 1992). In the following section, we demonstrate common methods for drawing analytic transcriptions of these kinds of interactional spatial configurations. We then discuss the challenges and design considerations for building a software tool to support drawing as a form of analytic transcription, specifically in the context of a live, collaborative data session.
2. Graphical methods for drawing interaction
Compared to the wealth of research and textbooks that deal with transcription techniques (e.g. Hepburn & Bolden 2016), there are relatively few methodological reflections on the graphical techniques used by conversation analysts to make illustrated transcripts (Ayaß 2015: 13). Laurier’s (2014) survey of approaches to ‘the graphic transcript’ in the CA literature shows that these illustration styles vary widely, from line-drawn overhead maps to stick figures, to photo-still comic strips. C. P. Heath’s (2014: 149-168) practice-based review ‘reconstructs’ and reflects on some of the most common illustration styles by illustrating the same piece of data while mimicking the styles of prominent interaction researchers such as Goodwin (2000) or Kendon (2010). While the analytic uses and affordances of these distinct illustration styles also vary widely, two primary observational drawing techniques, which have been mainstays of art education since at least the mid-17th Century, underpin the graphical methods used to produce them. These include ‘still life’ techniques: drawing static arrangements of objects, and ‘life’ or ‘figure drawing’ techniques, which involve sketching proportions, volumes and dynamics of the human body (Efland 1990, pp 35-38). Inspired by a series of practice-based research workshops and by calls to explore drawing as a research practice within the social sciences (Priego 2016; Hurdley 2017), we ask how these observational graphical techniques function as analytic practices. In the following section, we explore how these methods are used in interaction research and discuss how they inscribe various forms of interactional relevance. We then then use these techniques to sketch interaction and embodiment during a ballet class in order to see how they might work as tools in a live data session such as JH suggests in Extract 1. Finally, we describe a prototype software tool designed to support video tracing and sketching specifically for use in interaction research.
2.1 Field inscriptions and negative space
Especially in still life drawing, emphasis is placed on ‘negative spaces’: the spaces between objects. This alleviates the tendency to fixate on the objects themselves by focusing the observer’s attention on relative spatial relationships (Chamberlain et al., 2011). When drawing bodies involved in interaction, detailed inscriptions of the negative spaces between bodies are often used to highlight forms of interactional relevance. For example, Kendon’s (2010: 234) ‘o-space’ is often depicted as a negative space in the center of a circle of people standing and talking. The o-space circumscribes the “inner space” of a participant-organized group of mutually available interactants. On a more granular level, researcher and artist Claude Heath’s graphical method of ‘field inscriptions’ (C. P. Heath 2014, pp 184-188) depicts the shared spaces used by architects engaged in a collaborative drawing task. Here the drawing analyst traces the series of “virtual gestural maquettes” that architects co-construct through (to paraphrase Mondada 2018) the multiple temporalities and spatialities of their interaction (C. P. Heath 2014: 129-148, see also Mondada 2012 and Murphy, Ivarsson & Lymer 2012). In Figure 1, for example, the resting hands of non-drawing participants frame these interactional spaces together with speech, shifts in posture, topical structure, artefacts in use and gaze organization. These behaviors are collated and timed, for example in ELAN video annotation system (Wittenburg, Brugman, Russel, Klassmann, & Sloetjes, 2006), they are then saved as a set of timed video key-frames, for tracing. C. P. Heath (2014) calls these ‘field inscriptions’ since they inscribe outlines of spaces that exist between participant's bodies and hands, highlighting where the field of interaction is being conducted. The field inscription can be understood as an analytic extension of Kendon’s ‘o-space’, differentiating between its topical sub-spaces, and offering different interpretations of the , temporary interactional spaces that the participants themselves establish and manipulate as they maintain a shared focal bodily configuration. (see also C. P. Heath & Healey 2011).
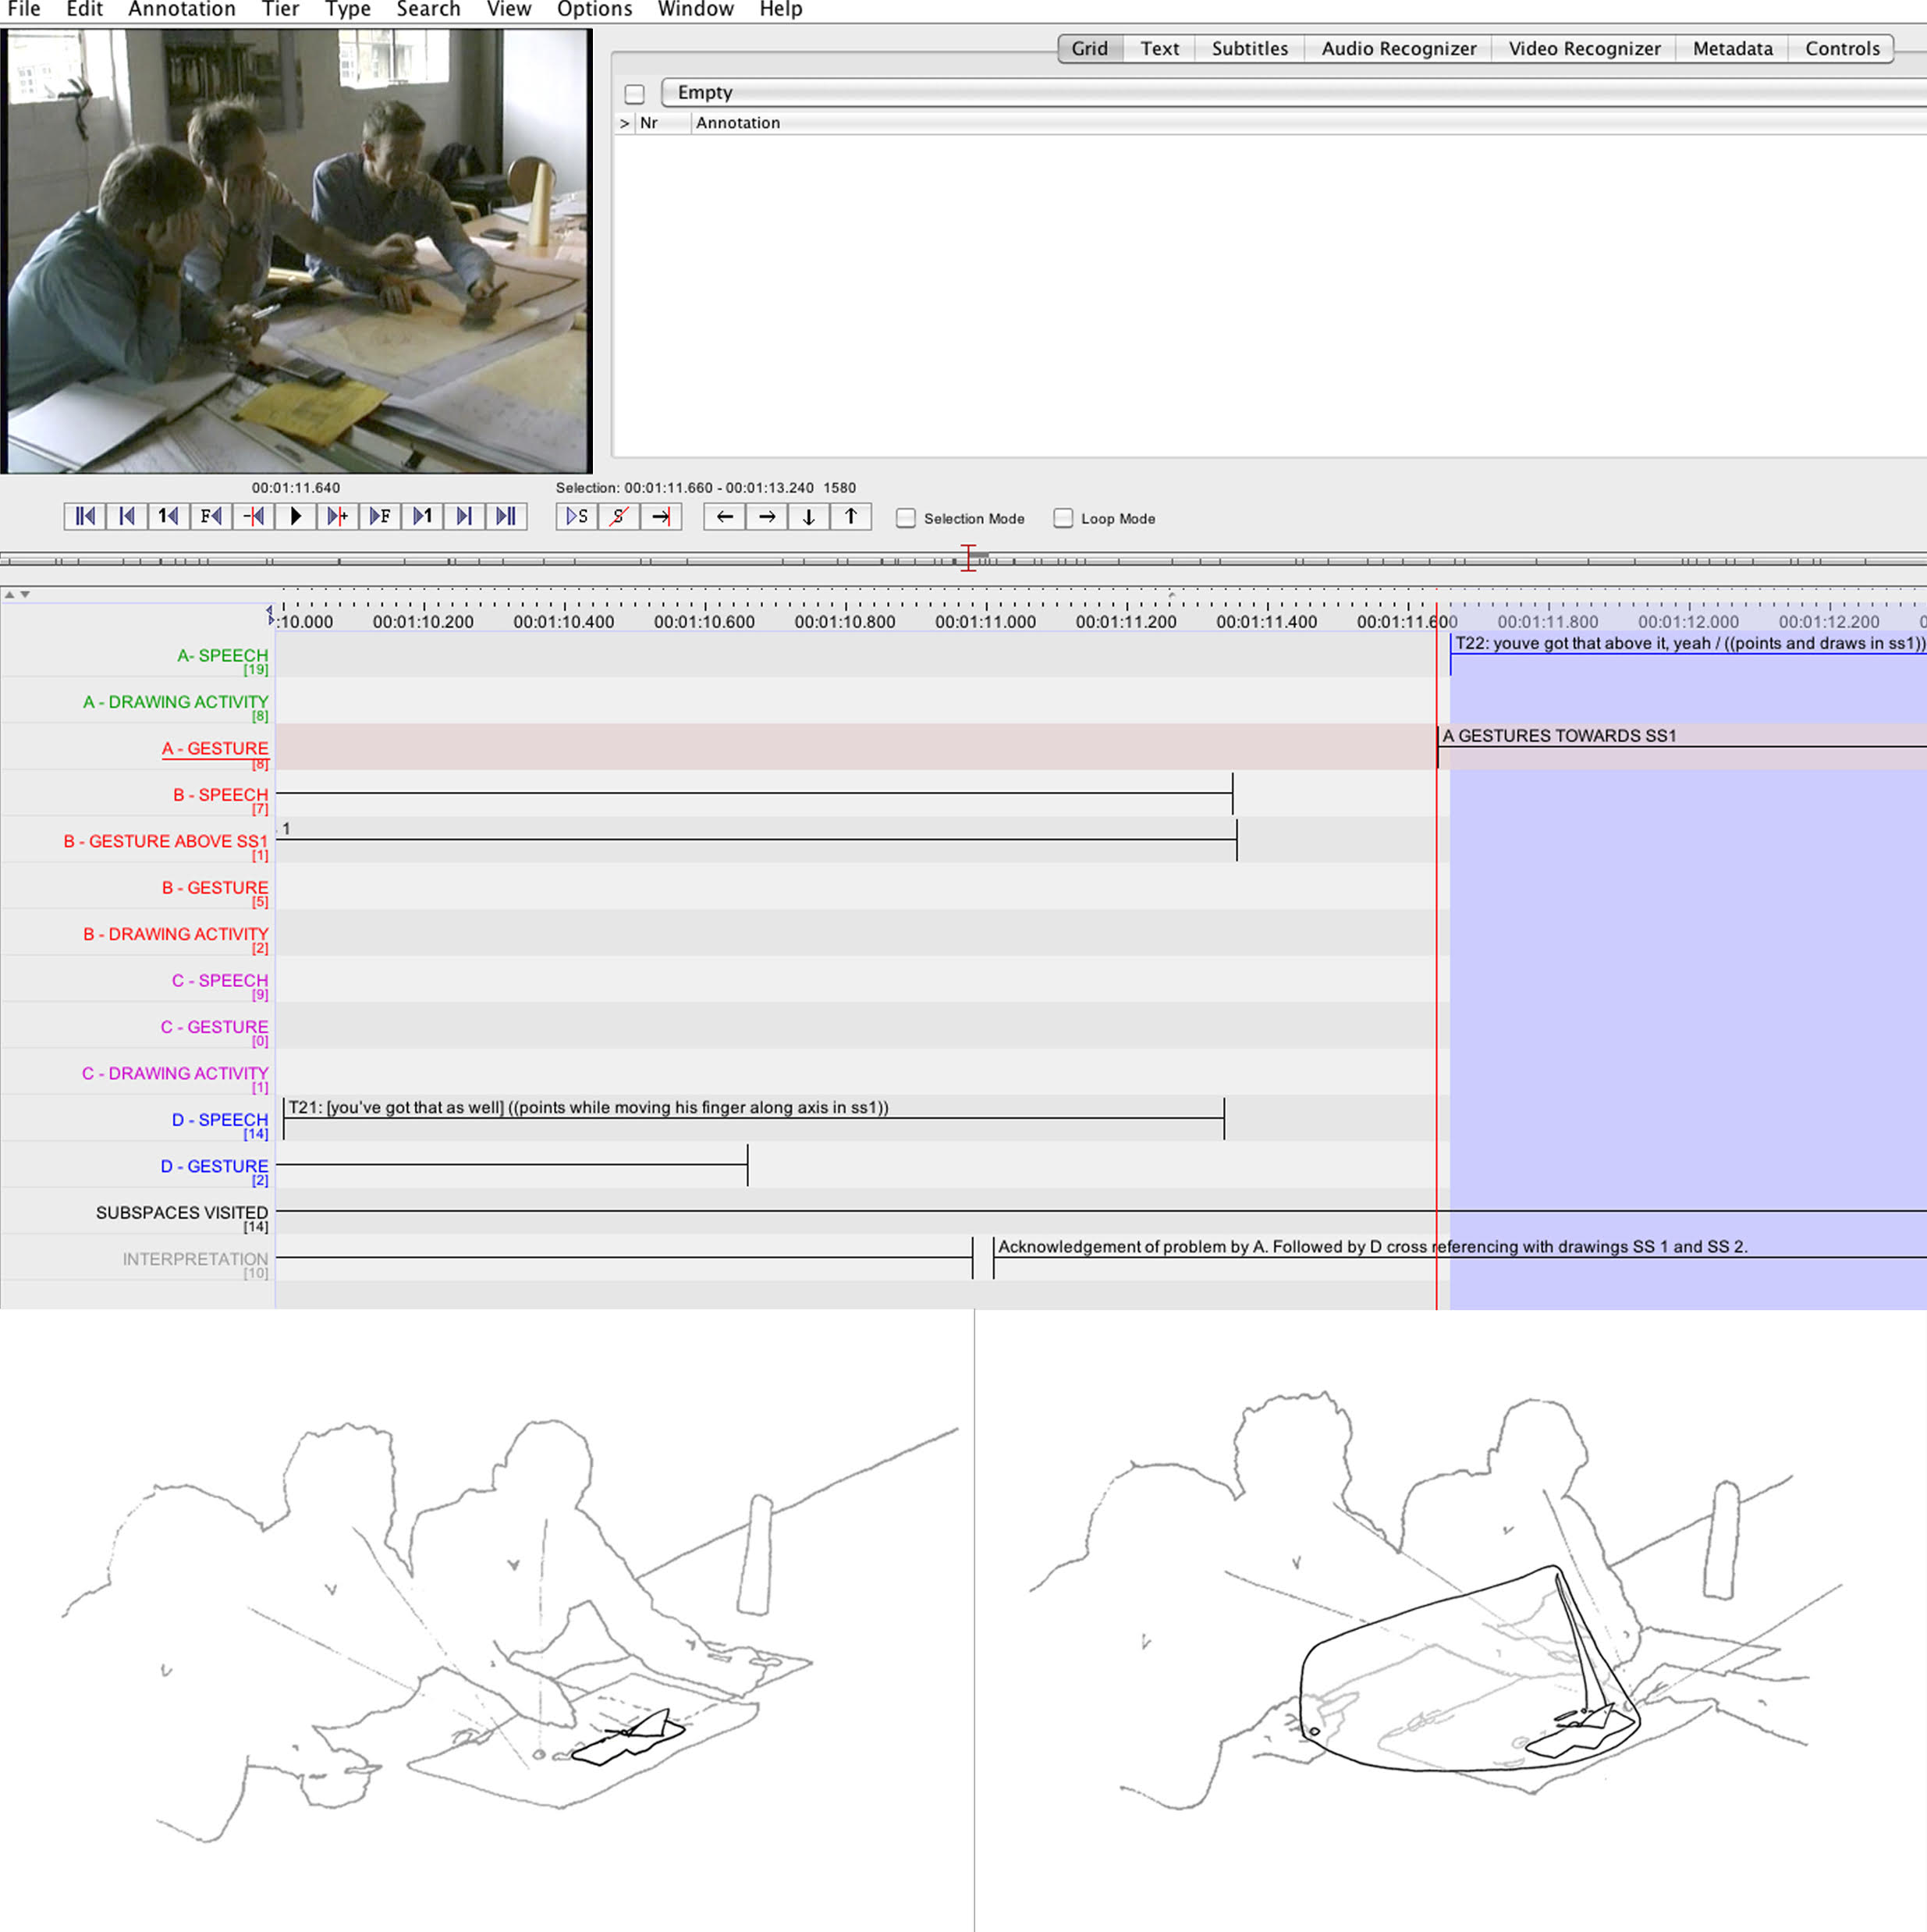
Figure 1. Architects aerial drawing gestures coded in ELAN (above), with a selection of field inscriptions (below) generated by tracing the shared space of their gesturing and drawing activity from C. P. Heath (2014: 130 Fig 3.1 and 230 Fig 5.32).
2.2 Figure drawing and postural details
Techniques from figure drawing also inform how interaction researchers depict human bodies when illustrating transcripts. Since Da Vinci’s anatomical drawings, life drawing has involved detailed understanding of musculoskeletal structure and the possible range of movement of different anatomical units, as well as weight shifts and limb coordination (Peto 2007). Working with video stills often involves trying to capture the posture of a human body that is not entirely visible. In this way, anatomical knowledge can be used to infer the position and counter-position of non-visible body parts and the stability or instability of postural configurations (e.g. Schegloff 1998). After sequential video analysis identifies moments of interactional relevance, analytic drawing can infer the dynamics of actions that may not be visible in video stills or in motion tracking data alone. Aside from tracing over video stills, figure drawing can also be useful for sketching instant ‘field notes’ when, for example, it may only be possible to record audio. It may still be possible to record the relationship between major skeletal structures such as the shoulders and the hips, as well as the alignment of the spine in a quick sketch. Even these minimal details can explain the bodily orientations of people interacting. For example, in Figure 2, even a few lines can pick out postural configurations and provide clues as to someone’s involvement (or their imminent withdrawal from involvement) in interaction.
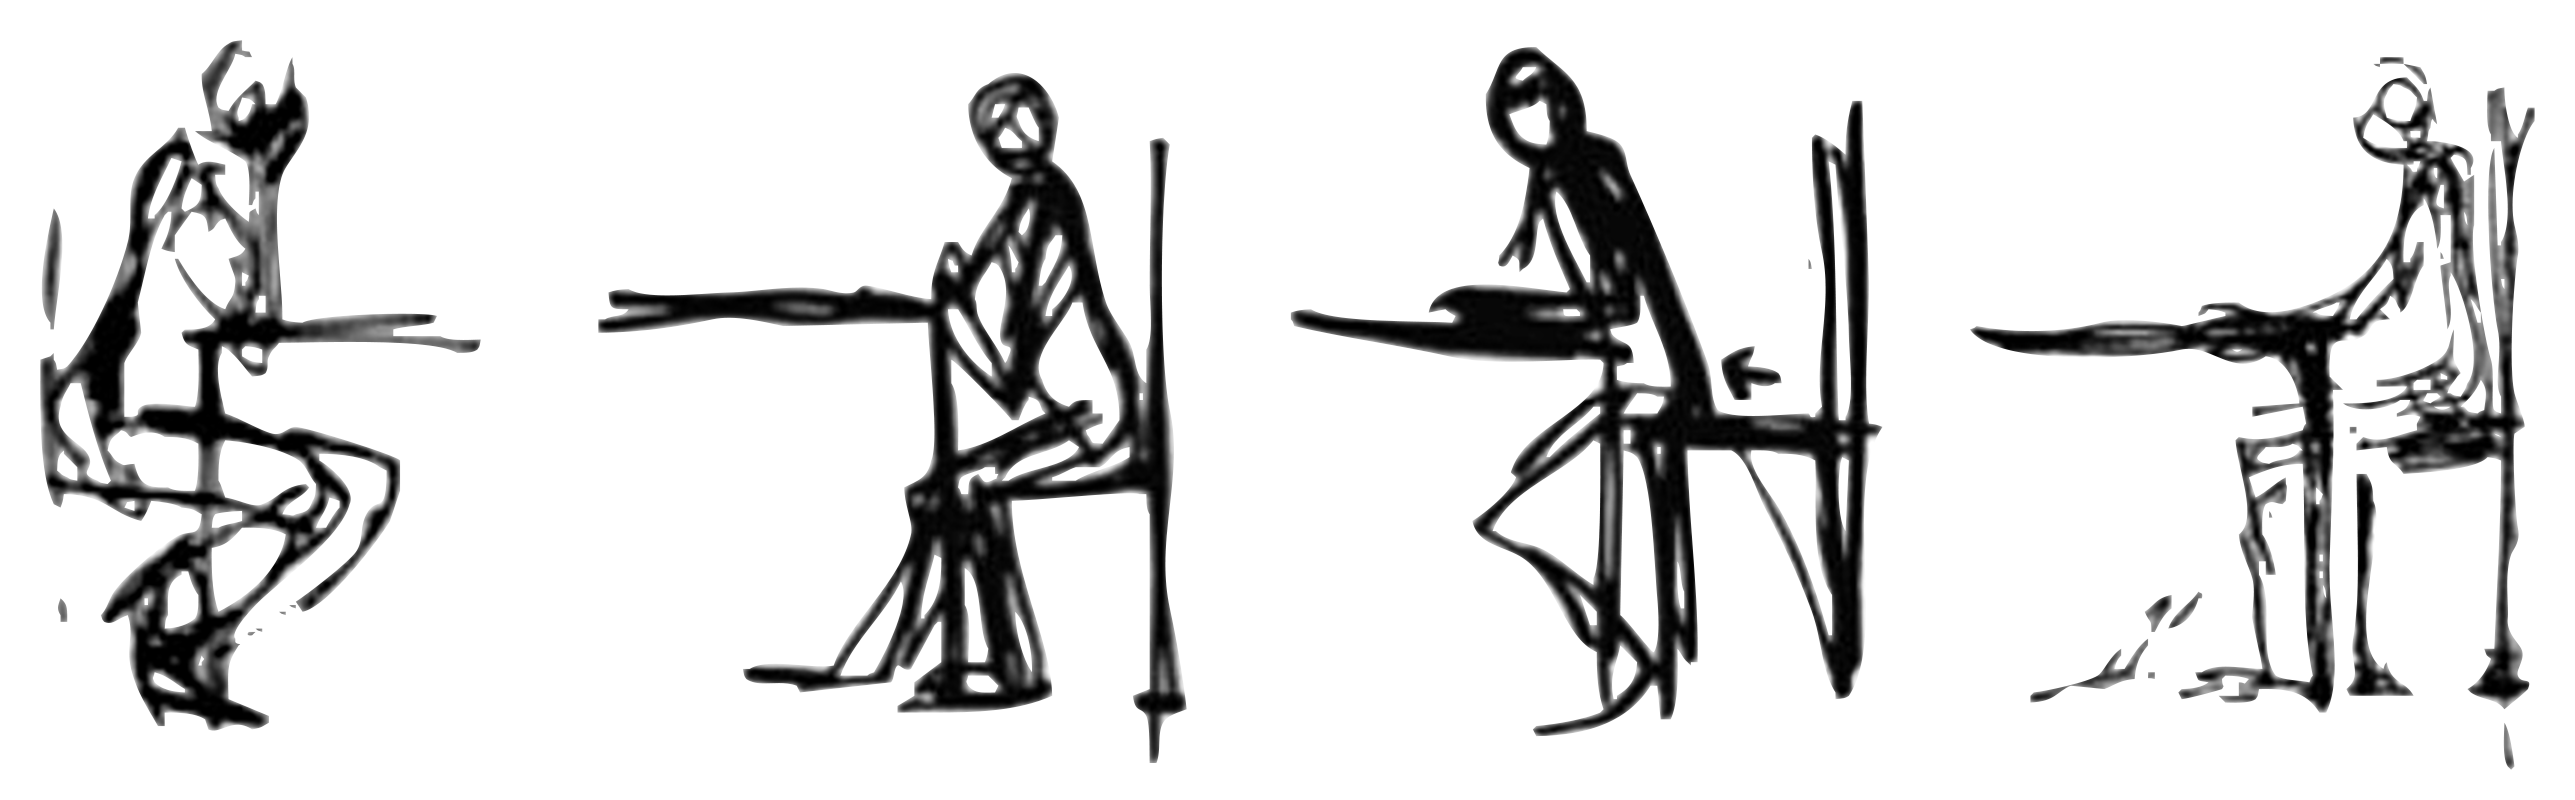
Figure 2. Simple stick figures can show seated postural configurations.
Drawing analysts can sketch major skeletal units then work outwards from the bone structure to the muscles and tissue and eventually reach the outer silhouette of the skin and/or the clothes. Each layer adds details of movement, posture and weight. For example, concentric circles can illustrate joint movement, weight shifts and postural changes that can be obscured by the flat plane of a video still. For example, Figure 3 (left) shows a foreshortened, stable, seated posture, while Figure 3 (right) shows a seated figure with their pelvis tipped forward. These graphical techniques enable the drawing analyst to pick out subtle postural details that can illustrate changes in participants’ preparedness to move, stand or lean.
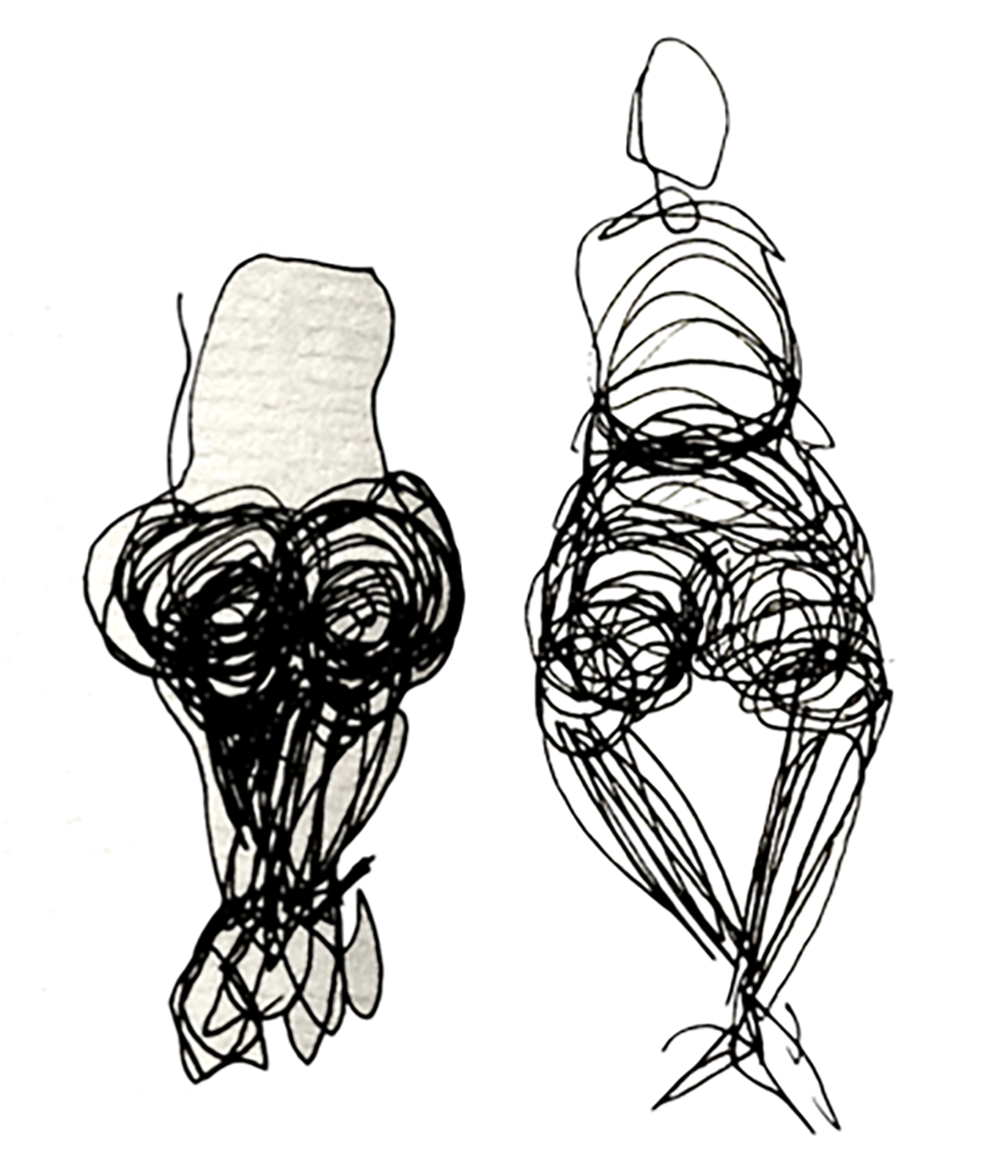
Figure 3. Circles can sketch ‘slices’ to illustrate, for example, a forward-leaning (left) versus a backward-leaning (right) seated posture.
2.3 Drawing interactions
In the following section, we report on how these graphical techniques of field inscriptions and figure drawing can be used to illustrate different aspects of embodied interaction. In order to explore this issue we ran two practice-based workshops with interaction analysts where we gave them simple tools such as fine colored markers and acetate sheets placed over laptop screens (see Figure 4) to refine these graphical methods, and to reflect on their possibilities and limitations.
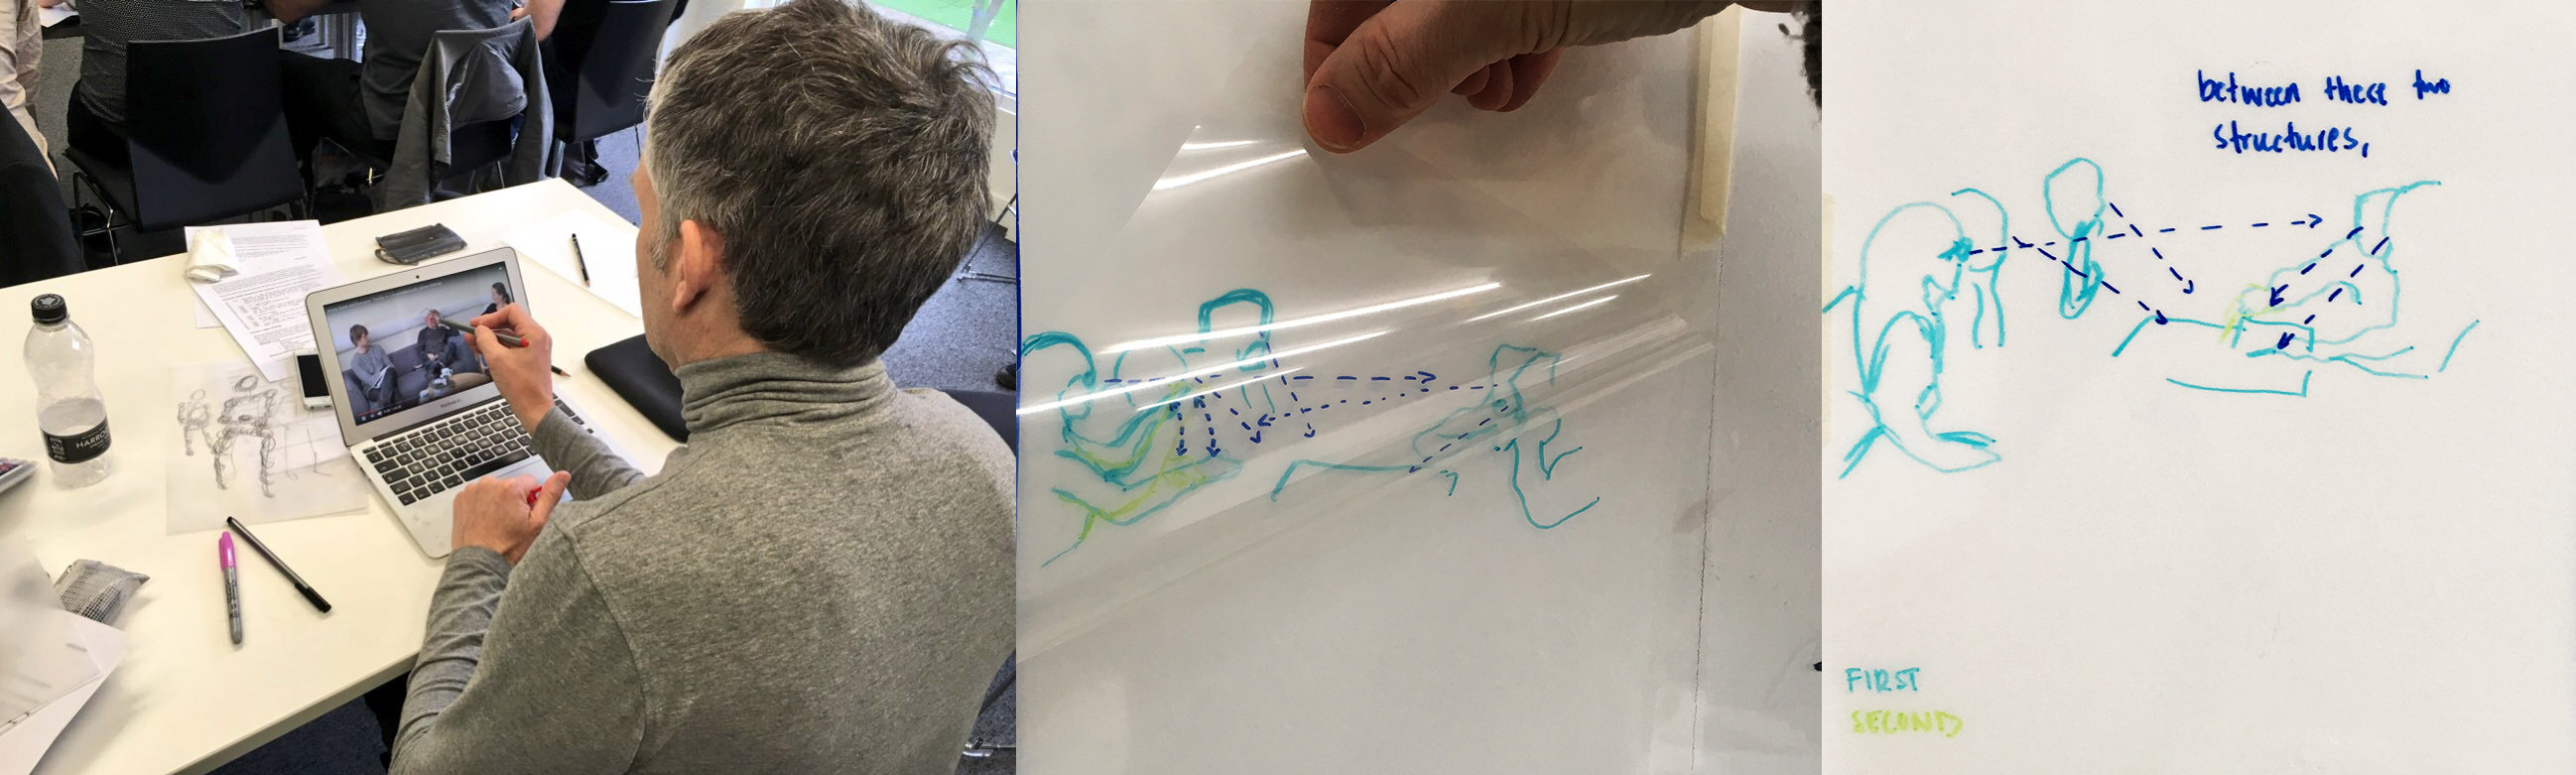
Figure 4. Interaction analysts drawing field inscriptions in a workshop session
In order to demonstrate these graphical methods in practice we then produced a series of drawings based on video data from a research project studying methods of achieving corrections in a ballet class[5]. In this ballet class format, the teacher provides the students with combinations of movements, which work as ad-hoc choreography. The students then perform to music provided by a pianist (off camera). In the clips below, students practice using the barre: a training handrail that provides stability. In the first case, the teacher provides a demonstrative correction, showing the students what they should do with their own movement. In the second two cases, the teacher performs a hands-on correction where she physically touches and corrects the movements of the dancers. We chose these specific moments and phenomena because they were challenging to represent with a talk-centric transcript alone, or with the existing repertoire of graphical formats such as video stills, gaze direction diagrams or schematics using arrows and lines. These analyses were produced during data sessions and collaborative drawing and writing involving the present group of co-authors, which includes professional interaction analysts, graphical artists and ballet dancers. Drawings are presented below alongside corresponding video clips, analytical observations, descriptions of the graphical methods used and an evaluation of their viability for analytic drawing of interaction.
2.3.1 Example 1: a demonstrative/vocal correction in a ballet class
In our first video clip, the teacher matches the trajectory of a student’s movement while using the shared space of the dance floor to demonstrate a correction to her footwork pattern.
In Figure 5, traced outlines of the teacher’s and students’ bodies suggest the coordinated forward trajectory of their movement, while also showing, in blue, their misaligned preparation phase of this movement. The teacher leads with her right leg, while the student leads with her left. The upright posture of the white outlines furthest to the left show here how their forward trajectory is cut short as the teacher glances down, initiating a vocal correction with “No:::? (.) right le:g.”.
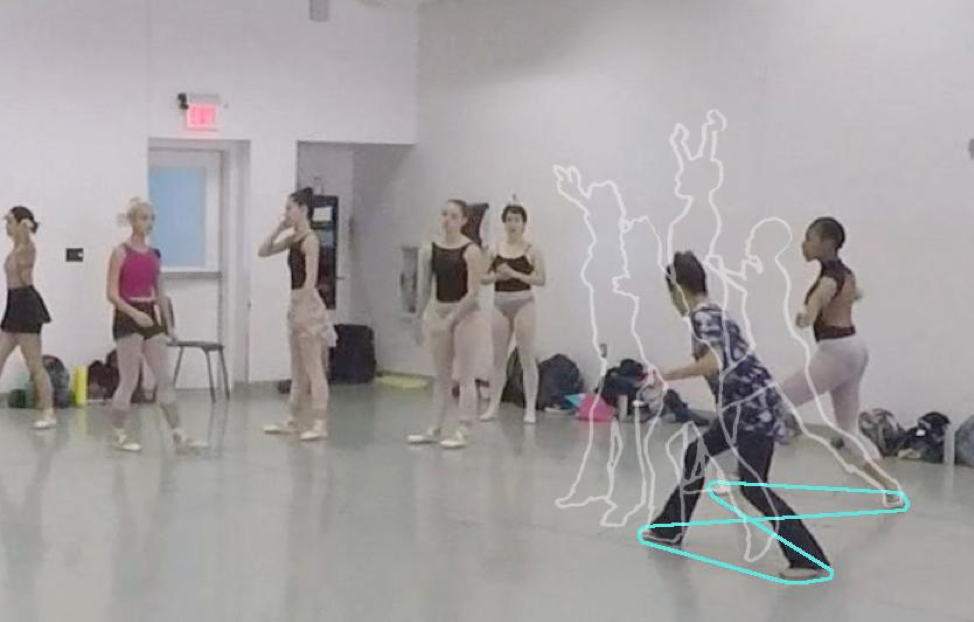
Figure 5. The teacher demonstrates a triple step forwards, then halts and drops, arresting the forward movement and correcting the student’s legs.
Figure 6, illustrates what happens once the pair re-do the practice sequence, this time with their legs aligned in the preparation phase in the photo. The student responds to the correction by starting the step with her right leg this time, and the ‘ghosted’ outlines of their movements show how their momentum carries them forwards as they continue with the now-corrected sequence.
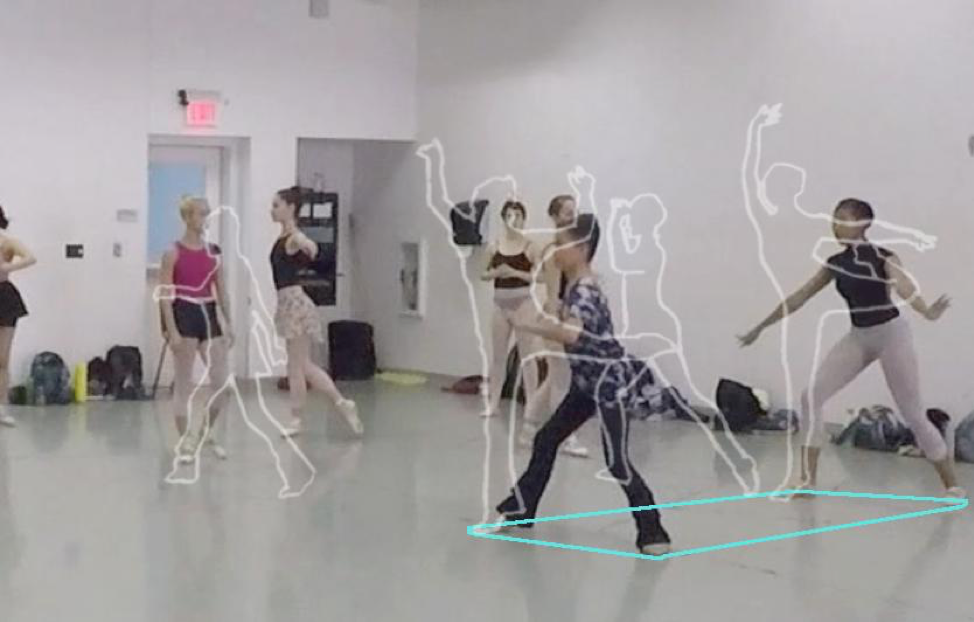
Figure 6. In the ‘corrected’ version, the student’s and teacher’s feet are aligned in the preparation phase of a through-produced movement.
These drawings work like field inscriptions that show the changing spatial relationships between bodies in this activity, highlighting the trajectory of their shared movements. They reveal aspects of the correction procedure and call attention to postural details such as the misaligned leg position that becomes interactionally relevant, in retrospect, via the teacher’s vocal correction. For the drawing analyst, these kinds of tracings can help to reconstruct the emergence of this error. However, this form of drawing is not easily legible as a sequence of events in the way a Jeffersonian transcript is legible to lay readers. The schematic outlines also miss out on some key details. In the following clip, we use figure drawing to explore these features of head and body position, joint movements and weight shifts that are only evident when bodies are seen as three-dimensional volumes, visible through changes in how they reflect light as they move.
2.3.2 Example 2: tactile corrections in a ballet class
In the following clip, the students are practicing a combination on the barre while the pianist plays. The teacher approaches a student from behind, places her hands on her shoulders, and begins to match her movement, adjusting the width of the students’ elbows but without stopping the student’s continued movement.
An initial point of analytic of interest that requires attention to details of postural configuration occurs when the teacher first touches the student’s shoulders and begins to match and correct her movements. Figure 7 shows several different stages in the development of a sketch of the student’s and teacher’s body positions immediately before and during this ‘tactile correction’. The student, who has been holding her hand on her belly, moves it back to the barre into a routine ‘home position’ (Sacks & Schegloff 2002) from which to receive her correction. Alongside other forms of textual and descriptive video analysis, figure drawing can show how this first moment of touch is accompanied by the teacher’s move into a posture matching that of the student. This observation can then inform our understanding of the course of the physical correction that the teacher then does.
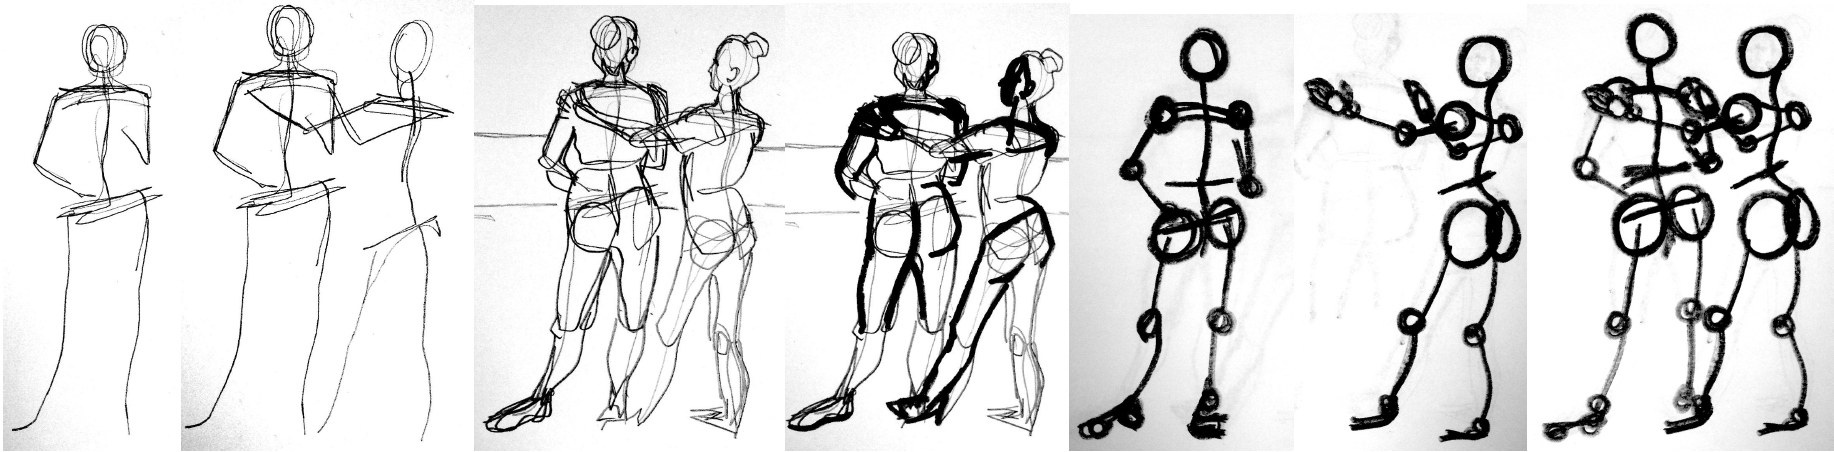
Figure 7. Line sketches showing postural configurations in video 3.
Similarly, very accurate characterization of postural detail is clearly important for the participants themselves given that this is a ballet class where the teacher’s correction deals with styling. For example, in the following clip the students have just finished a combination when the teacher approaches one student and begins manipulating her head position in order to demonstrate postural styling to the class.
In the transcript of the teacher’s talk in Extract 1, her hesitant descriptions are interspersed with pauses during which she begins to physically manipulate the head position of a student before using her own postural configuration to model a ‘regal’ head position to the class.
Extract 1: 2017-10-BC-physical-1926-2144-head-to-side/regal
The series of drawings in Figure 8 pick out some key details of the ‘target’ postural configuration. Specifically, they depict the postures of the teacher and student during the (1.0) beat pause line 16, which coincides with students’ laughter.
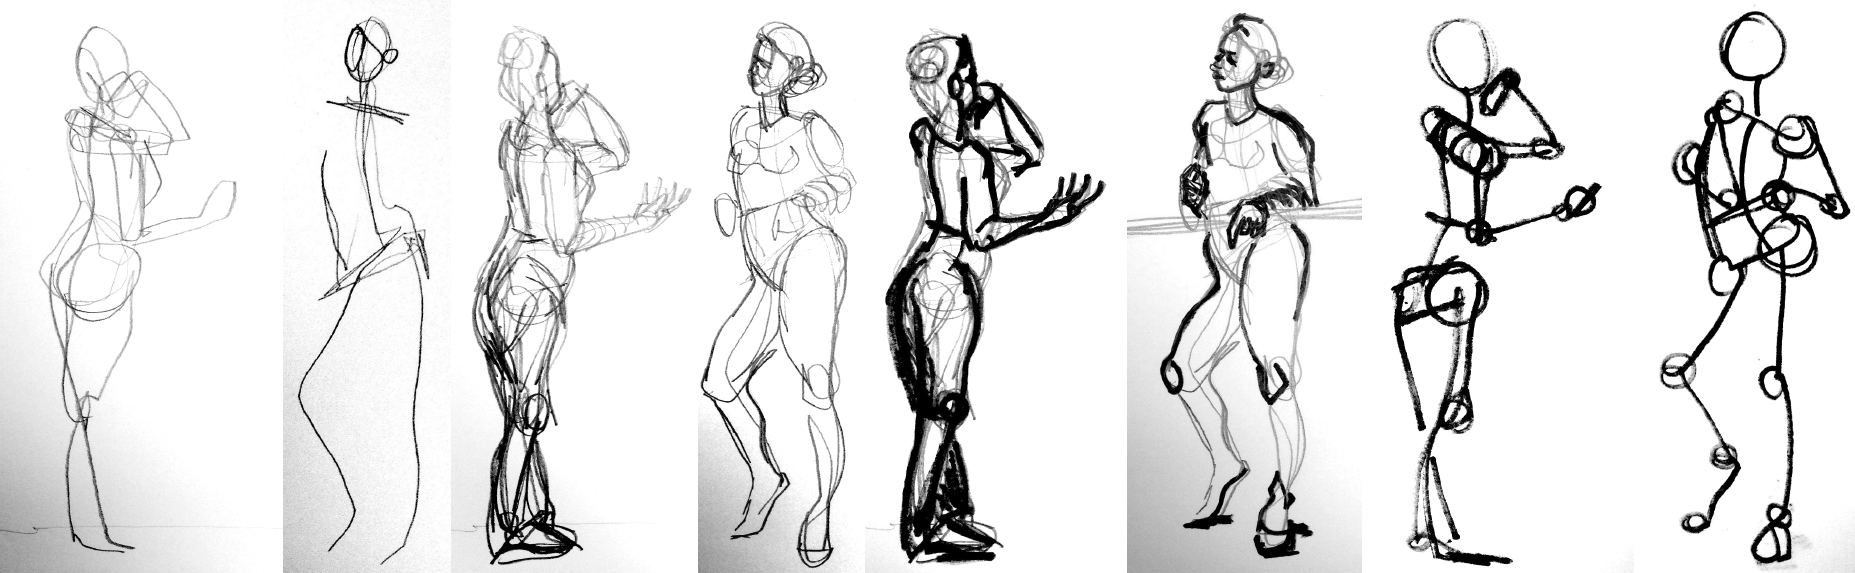
Figure 8. Line drawings showing postural configurations in video 4.
At this moment in the correction and instruction sequence of the video, the teacher demonstrates a ‘regal’ head position by pushing her nose upwards with her finger. Here the student, who has just served as a model for the ‘humble’ pose and is still standing straight with her feet turned out, has just shifted into a relaxed contrapposto stance. This new postural configuration shows how the student treats this as an opportunity to move ‘off-stage’ and re-join the rest of the class in observing the teacher’s demonstration. Drawing a snapshot of the teacher’s bodily-vocal demonstration (Keevallik 2014) highlights here how she invites students to pay close attention to her posture and specific head position. However, while these sketches are more immediately legible than the field inscriptions in Figures 5 and 6, they cannot capture the dynamism and precision timing of the teacher’s and students’ postural shifts. Figure drawings focus so closely on figures that they easily fail to capture the spatial coordination of all participants’ bodies including those of other student dancers, who stand and watch, framing and upholding the teacher’s action as a demonstrative correction.
2.3.3 Software to support drawing interaction
Drawing is able to encode nuanced interpretations of space, bodies and time into analytic representations, but as Mondada (2018: 100) points out, a key challenge for multimodal transcription is to find ways to balance the multiple temporalities of relative, emic, “praxeological time” in which interactional relevance unfolds, against the passage of “abstract, measured, homogeneous” time. The graphical techniques described here, which underpin many of the illustrations published in interaction research, are useful for analysis in that they require analysts to do detailed observational drawings from video data. However, at least in our own attempts, the resulting drawings are not necessarily as useful for the practical activity of data analysis as Jeffersonian transcripts. Following Jefferson’s (2004: 13) suggestion that transcription is a preliminary to data analysis, and the ideas raised by seeing how analysts use interaction itself as a tool in data sessions, we created a prototype stylus-based drawing app[6] based on three guiding principles. Firstly, it should be possible to make observations while working directly with video data and to use a range of drawing methods including both field inscriptions and figure drawings. Secondly, the software tool should import from and export to other digital transcript[7] and video formats such as 3D video data. Thirdly, the interface of the tool should be designed to integrate and synthesize all these data types and forms of analytic inscription, primarily for use in a collaborative data session such as the episode analyzed in Section 1.2 above.
The Drawing Interactions software prototype[8] supports these premises in the following ways:
(1) A visible timeline allows analysts to pause, scrub and manipulate time collaboratively.
(2) Users can annotate and trace over freeze-framed imagery using a pressure-sensitive stylus.
(3) Drawings are combined as thumbnails along the timeline in order to provide a graphical overview.
(4) Users can ‘draw through time’ while scrubbing the timeline, creating animated highlights.
These features are outlined in this demo together with links to documentation and source code. While this demo only touches on the possible functions of such a system by showing indicative highlights and annotations rather than full drawings, the key feature to highlight is the ability to ‘draw through time’, where the stylus of the drawing analyst traces the gestures of the participants while scrubbing through the video timeline. These animated inscriptions hint at how software designed for interaction analysis might begin to address the challenges of inscribing the multiple temporalities of social interaction in a readily legible way.
This tool is still at a very early stage of development, and therefore this article has aimed to contextualize its initial design process in order to encourage further theoretical and practical discussions before the next stage of development. In the final section of this paper we outline some of those discussions and conclude with some suggestions as to how the prototype could be developed as a tool for analysis.
4 Discussion & Conclusion
In this paper, we have focused on common graphical techniques used to produce illustrations and graphic transcripts in interaction research, and have looked at the limitations of the ways Jeffersonian transcripts are used in practice in collaborative data sessions, especially for analyzing embodiment and multimodality. We have demonstrated the use, potentials and limitations of two graphical techniques including ‘field inscriptions’ and figure drawing in analytic transcripts. The prospect of refining these methods further and supporting them with software tools requires further practice-based research and critical discussion, which this article aims to stimulate. It also adds to a small line of inquiry about graphical techniques (e.g. Laurier 2014; C. P. Heath 2014) within a far more extensive discussion about transcription in interaction research, which has tended to focus on problems with technical adequacy or theoretical commitments for the specific task of analyzing talk-in-interaction (Ochs 1979; Lapadat & Lindsay 1999; Bucholtz 2000; 2007). This paper also contributes to the burgeoning literature on transcribing multimodality, mobility and materiality in interaction research (Nevile 2015; Mondada 2016; 2019), and to discussions of multimodal transcription standards for interaction research (Mondada 2018). While Mondada’s (2018) transcription format and related methods of transcribing visible conduct (e.g. Heath, Hindmarsh & Luff 2010: 70-82) combine many of the strengths of Jeffersonian transcription for communicating research findings, this article adds some key questions and ideas about the use of transcripts during data analysis, and about the basic graphical techniques used to produce research illustrations.
As Goodwin (2007: 27) points out, it makes sense for analysis and transcription to focus on text and talk, since after several millennia of developing tools and techniques for capturing speech, “there are no systems comparable to writing for the rapid and precise annotation of the other embodied modalities that contribute to the organization of face-to-face interaction”. While we agree with this assessment in relation to the talk-centric history of CA and other traditions within interaction research, in general we suggest that drawing’s long history offers many techniques and opportunities for developing new approaches to transcribing embodied action. For example, the two drawing methods that we present here, field inscriptions and figure drawing, build on widespread and intuitively recognizable traditions and artistic practices. Field inscriptions extend a contemporary notion of architectural space that ‘redefines ‘the nature of the relation between figure and ground’ (Allen 1997, p.134), while figure drawing refers to methods of representing anatomy and spatial perspective that were first formalized as part of artistic training during the Renaissance (Kristeller 1951). We suggest that drawing as a method of analytic inscription can be adapted to identify both the ‘facts’ as recorded by the lenses and sensors of digital video cameras, and the ‘normative connections’ that unfold through social interaction (Nishizaka 2015). As our experiences with prototype development have shown, software-based drawing systems can capture inscriptions across the multiple temporalities of interaction as recorded on digital video. Software can also be designed to support CA’s core research procedures of analytic transcription and data sessions, where inductive findings are developed reflexively through interaction between expert analysts. We conclude that graphical techniques and drawing can provide a set of tools and procedures that will compliment Jeffersonian transcripts, where interactional phenomena can be identified, described and communicated through the practice of analytic drawing.
Acknowledgements
Many thanks to Berklee College of Music and the 2017 Newbury Comics Faculty Fellowship for supporting this work, and to the teachers and students who allowed us to record and share video footage of their ballet class. Thanks also to Michael Mair and the organizers of the New Developments in Ethnomethodology event for hosting the Drawing Interactions workshop. Sophie Skach’s work was supported by the Engineering and Physical Sciences Research Council (EPSRC) through the Media and Arts Technology Programme, a Research Councils UK Centre for Doctoral Training (EP/G03723X/1). We would also like to thank your two anonymous reviewers for their insightful comments on the first draft of this paper.
Bibliography
Allen, S., (1997). From Object to Field, Architecture and urbanism. Architectural Design, (127), pp. 24–31.
Ayass, R. (2015). Doing data: The status of transcripts in Conversation Analysis, Discourse Studies, Vol. 17 No. 5, pp. 505–528. https://doi.org/10.1177/1461445615590717
Bolden, G. B. (2015). Transcribing as Research: ‘Manual’ Transcription and Conversation Analysis. Research on Language and Social Interaction, Vol. 48 No. 3, pp. 276–280. https://doi.org/10.1080/08351813.2015.1058603
Bucholtz, M. (2000). The politics of transcription. Journal of Pragmatics, Vol. 32 No. 10, pp.1439–1465. https://doi.org/10.1016/s0378-2166(99)00094-6
Bucholtz, M. (2007). Variation in transcription. Discourse Studies, Vol. 9 No. 6, pp. 784–808. https://doi.org/10.1177/1461445607082580
Chamberlain, R., Riley, H., McManus, C., and Brunswick, N., (2011). The Perceptual Foundations of Drawing Ability. In Thinking through drawing: practice into knowledge. Proceedings of an interdisciplinary symposium on drawing, cognition and education, Teachers College Columbia University, pp. 95–102.
Coulter, J. (2005). Language without mind. In te Molder, H. & Potter, J. (Eds.), Conversation and Cognition, Cambridge University Press, Cambridge, pp. 79-92.
Drew, P. (2016). Gail Jefferson and the development of transcription. In Hepburn & Bolden (Eds.), Transcribing for Social Research, Sage, London, pp. 16-17.
Efland, A. (1990). A history of art education: intellectual and social currents in teaching the visual arts. Teachers College Press, New York, NY.
Garfinkel, H. (1966). Labanotation--Discussion #1--6/30/66 Haward Schwartz, Gail Ziferstein, Howard Garfinkel, Garfinkel Archive, Newburyport, MA, d #20.
Goodwin, M. H. (1980). Processes of Mutual Monitoring Implicated in the Production of Description Sequences. Sociological Inquiry, Vol. 50, pp. 303-317. DOI:https://doi.org/10.1111/j.1475-682X.1980.tb00024
Goodwin, C., & Goodwin, M. H. (1992). Context, activity and participation. In Auer, P. & Luzio, A. D. (Eds.), The Contextualization of Language, John Benjamins Publishing Company, Amsterdam, pp. 77-100.
Goodwin, C. (2000). Action and embodiment within situated human interaction. Journal of Pragmatics, Vol. 32 No. 10, pp.1489–1522. https://doi.org/10.1016/S0378-2166(99)00096-X
Goodwin, C. (2007). Interactive footing. In Holt E. & Clift R. (Eds.), Reporting Talk, Cambridge University Press, Cambridge, pp. 16-46. https://doi.org/10.1017/CBO9780511486654.003
Guest, A. H. (2013). Labanotation: The System of Analyzing and Recording Movement. Routledge, London.
Healey, P. G. T., & Peters, C. R. (2007). The Conversational Organisation of Drawing. In First International Workshop on Pen-Based Learning Technologies (PLT 2007), IEEE. https://doi.org/10.1109/plt.2007.25
Haviland, J. B. (2000). Pointing, gesture spaces, and mental maps. In McNeill, D. (Ed.), Language and Gesture, Cambridge University Press (CUP), pp. 13-46. https://doi.org/10.1017/cbo9780511620850.003
Heath, C. (1984). Talk and recipiency: Sequential organization in speech and body movement. In Atkinson, J. M. & Heritage, J. (Eds.), Structures of social action: Studies in conversation analysis, Cambridge University Press, Cambridge, pp. 247-265. https://doi.org/10.1017/CBO9780511665868.017
Heath, C., & Luff, P. (2011). Gesture and institutional interaction. In Streeck et al. (Eds.), Embodied Interaction, Cambridge University Press, Cambridge, pp. 276-288.
Heath, C., Hindmarsh, J., & Luff, P. (2010). Video in qualitative research: analysing social interaction in everyday life. Sage Publications, London.
Heath, C. P. (2014). Drawing out interaction: Lines around shared space. Unpublished PhD Thesis, Queen Mary University of London.
Hindmarsh, J. (2012). Heath’s natural habitat: The data session. In Luff. P., Hindmarsh, J., vom Lehn D, & Schnettler, B. (Eds.), Work, Interaction and Technology: A Festschrift for Christian Heath, Dept. of Management, King’s College London, London, pp. 21-23.
Jefferson, G. (2004). Glossary of transcript symbols with an introduction. In Lerner G. H. (Ed.), Conversation Analysis: Studies from the First Generation, John Benjamins Publishing Company, Amsterdam and Philadelphia, pp. 13-34.
Kendon, A. (1990). Conducting Interaction: Patterns of behavior in focused encounters. Cambridge University Press, Cambridge, New York.
Kendon, A. (2010). Spacing and Orientation in Co-present Interaction. In Development of Multimodal Interfaces: Active Listening and Synchrony, Springer Berlin Heidelberg, pp. 1-15. https://doi.org/10.1007/978-3-642-12397-9_1
Lapadat, J. C. & Lindsay, A. C, (1999). Transcription in research and practice: From standardization of technique to interpretive positionings. Qualitative Inquiry, Vol, 5 No. 1, pp. 64–86.
Laurier, E. (2014). The Lives Hidden by the Transcript and the Hidden Lives of the Transcript. Unpublished manuscript.
Lynch, M. (2005). The production of scientific images: Vision and re-vision in the history, philosophy, and sociology of science. Communication & Cognition, Vol. 31 No. 2/3, pp.213-28.
MacWhinney, B. (2000). The CHILDES Project: Tools for Analyzing Talk. 3rd Edition, Lawrence Erlbaum Associates, Mahwah, NJ.
McNeill, D. (2003). Pointing and morality in Chicago. In S. Kita (Ed.), Pointing: Where language, culture, and cognition meet, Erlbaum, Mahwah, NJ, pp. 293-306.
Mondada, L. (2019). Contemporary issues in conversation analysis: Embodiment and materiality, multimodality and multisensoriality in social interaction. Journal of Pragmatics. https://doi.org/10.1016/j.pragma.2019.01.016
Mondada, L. (2018). Multiple Temporalities of Language and Body in Interaction: Challenges for Transcribing Multimodality. Research on Language and Social Interaction, Vol. 51 No. 1, pp. 85–106. https://doi.org/10.1080/08351813.2018.1413878
Mondada, L. (2016). Challenges of multimodality: Language and the body in social interaction. Journal of Sociolinguistics, Vol. 20 No. 3, pp. 336–366. https://doi.org/10.1111/josl.1_12177
Mondada, L. (2012). Video analysis and the temporality of inscriptions within social interaction: the case of architects at work. Qualitative Research, Vol. 12 No. 3, pp. 304–333.
Murphy, K. M., Ivarsson, J. & Lymer, G. (2012). Embodied reasoning in architectural critique. Design Studies, Vol. 33 No. 6, pp. 530–556. https://doi.org/10.1016/j.destud.2012.06.005
Nevile, M. (2015). The Embodied Turn in Research on Language and Social Interaction. Research on Language and Social Interaction, Vol. 48 No. 2, pp.121–151. https://doi.org/10.1080/08351813.2015.1025499
Nishizaka, A. (2015). Facts and Normative Connections: Two Different Worldviews. Research on Language and Social Interaction, Vol. 48 No. 1, pp. 26–31. https://doi.org/10.1080/08351813.2015.993840
Ochs, E. (1979). Transcription as theory. In Ochs, E. & Schieffelin B. B. (Eds.), Developmental pragmatics, Academic Press, New York, pp. 43-72.
Peto, J. (2007). The Heart. Yale University Press, New Haven, CT.
Priego, E. (2016). Comics as Research, Comics for Impact: The Case of Higher Fees, Higher Debts. The Comics Grid: Journal of Comics Scholarship, Vol 6, p.16. DOI: http://doi.org/10.16995/cg.101
Ten Have, P. (1999). Doing conversation analysis: A Practical Guide (1st ed.). Sage Publications, London.
Sacks, H. (1984). Notes on methodology. In Atkinson, J.M. (Ed.), Structures of social action: Studies in conversation analysis, Cambridge University Press, London, pp. 21-27.
Sacks, H., & Schegloff, E. A. (2002). Home position. Gesture, Vol. 2, pp. 133–146. DOI: https://doi.org/10.1075/gest.2.2.02sac
Schegloff, E. A. (1998). Body torque. Social Research, Vol. 65 No. 5, pp. 536–596.
Wittenburg, P., Brugman, H., Russel, A., Klassmann, A., Sloetjes, H. (2006).
ELAN: a Professional Framework for Multimodality Research, in: Proceedings of LREC 2006, Fifth International Conference on Language Resources and Evaluation.